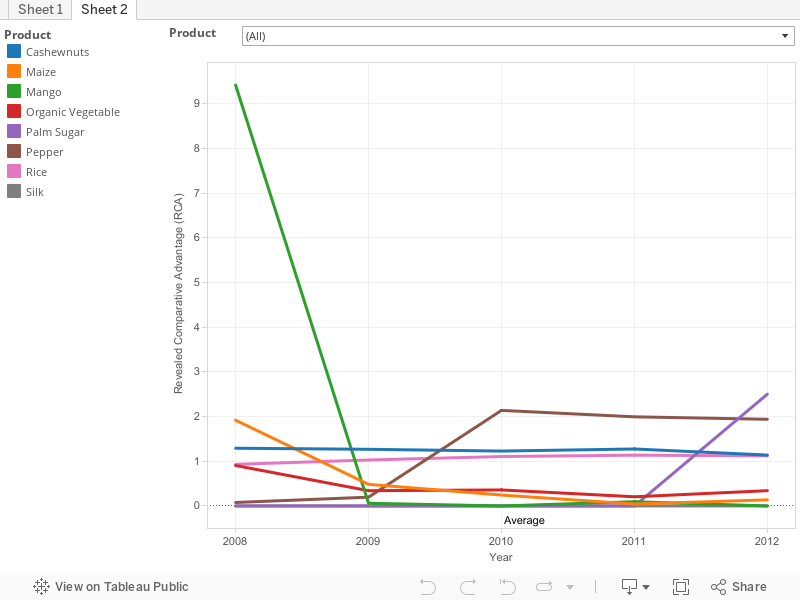
The Revealed Comparative Advantage (RCA) is a trade analysis tool to measure and assess the competitive advantage of the product which the business people need to export. The RCA indicates whether a country's product is in the process of extending the products in which it has a trade potential or simply competitive advantage. The values of an RCA indicate the country's competitiveness vis-à-vis the world. It also helps to assess a country's export potential.
Results indicated that
A value of less than unity implies that the country has a revealed comparative disadvantage in the product.
If the index exceeds unity, the country is said to have a revealed comparative advantage in the product.
Unit : US Dollar Thousand
Product -- HS Code
Year
Cambodia export to the World
Total exports from Cambodia
World's exports
World's total exports
RCA
Cashew nut -- 080131
2009
803.00
803.00
2,462,132.00
3,122,760.00
1.27
2010
84.00
84.00
3,034,268.00
3,728,027.00
1.23
2011
514.00
514.00
4,572,253.00
5,831,358.00
1.28
2012
781.00
796.00
6,385,461.00
7,413,651.00
1.14
2008
915.00
916.00
2,718,551.00
3,516,683.00
1.29
Maize -- 1005
2009
1,563.00
12,629.00
19,839,367.00
77,522,599.00
0.48
2010
2,519.00
37,284.00
23,326,145.00
84,277,771.00
0.24
2011
1,371.00
107,880.00
34,446,927.00
116,989,931.00
0.04
2012
6,365.00
155,237.00
35,496,971.00
118,046,875.00
0.14
2008
2,425.00
4,864.00
27,175,240.00
104,659,815.00
1.92
Mango -- 080450
2008
184.00
1,216.00
1,060,389.00
70,658,047.00
10.08
2009
1.00
886.00
1,134,602.00
67,319,260.00
0.07
2010
N.A
N.A
N.A
N.A
0.00
2011
1.00
587.00
1,504,478.00
87,563,538.00
0.10
2012
N.A
N.A
N.A
N.A
N.A
Organic Vegetable -- 07
2009
493.00
30,466.00
48,762,745.00
1,029,694,969.00
0.34
2010
1,007.00
57,779.00
56,352,528.00
1,158,109,425.00
0.36
2011
836.00
91,735.00
62,413,183.00
1,405,942,333.00
0.21
2012
2,531.00
180,144.00
57,928,899.00
1,409,860,576.00
0.34
2008
1,171.00
30,116.00
49,196,426.00
1,145,031,473.00
0.90
Palm Sugar -- 170114
2010
N.A
N.A
N.A
N.A
N.A
2011
N.A
N.A
N.A
N.A
N.A
2012
12,483.00
12,483.00
13,295,770.00
33,278,489.00
2.50
2008
N.A
N.A
N.A
N.A
N.A
2009
N.A
N.A
N.A
N.A
N.A
Pepper -- 090411
2011
1,211.00
1,238.00
1,609,396.00
3,282,773.00
2.00
2012
232.00
236.00
1,733,660.00
3,421,858.00
1.94
2008
25.00
719.00
960,536.00
2,146,736.00
0.08
2009
37.00
455.00
803,277.00
1,941,144.00
0.20
2010
77.00
77.00
1,070,907.00
2,291,224.00
2.14
Rice -- 100630
2010
32.56
34.75
17,133.74
20,232.06
1.11
2011
103.17
106.37
20,347.22
23,849.95
1.14
2012
139.11
148.70
18,502.64
22,159.64
1.12
2008
1.94
2.43
18,132.44
21,156.33
0.93
2009
9.58
11.00
15,753.65
18,615.94
1.03
Silk -- 50
2010
4.00
3,056,561.00
3,270,232.00
644,504,758.00
0.00
2011
6.00
4,014,443.00
3,400,828.00
759,366,823.00
0.00
2012
19.00
6,254,634.00
3,155,488.00
741,033,536.00
0.00
2008
5.00
3,024,773.00
3,539,764.00
651,119,216.00
0.00
2009
2.00
2,452,415.00
2,788,017.00
559,788,889.00
0.00