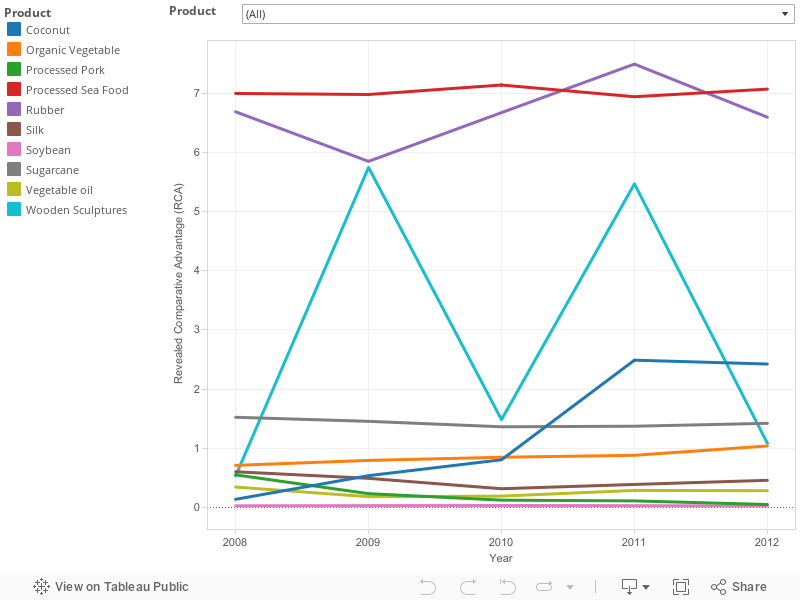
The Revealed Comparative Advantage (RCA) is a trade analysis tool to measure and assess the competitive advantage of the product which the business people need to export. The RCA indicates whether a country's product is in the process of extending the products in which it has a trade potential or simply competitive advantage. The values of an RCA indicate the country's competitiveness vis-à-vis the world. It also helps to assess a country's export potential.
Results indicated that
A value of less than unity implies that the country has a revealed comparative disadvantage in the product.
If the index exceeds unity, the country is said to have a revealed comparative advantage in the product.
Unit : US Dollar Thousand
Product -- HS Code
Year
Thailand export to the World
Total exports from Thailand
World's exports
World's total exports
RCA
Coconut -- 080111
2008
269.00
13,581.00
518,861.00
3,516,683.00
0.13
2009
833.00
12,661.00
384,400.00
3,122,760.00
0.53
2010
1,211.00
15,459.00
363,574.00
3,728,027.00
0.80
2011
8,256.00
26,229.00
737,562.00
5,831,358.00
2.49
2012
5,555.00
30,745.00
552,706.00
7,413,651.00
2.42
Organic Vegetable -- 07
2009
857,719.00
22,840,957.00
48,762,745.00
1,029,694,969.00
0.79
2010
1,071,404.00
26,023,035.00
56,352,528.00
1,158,109,425.00
0.85
2011
1,278,340.00
32,759,997.00
62,413,183.00
1,405,942,333.00
0.88
2012
1,370,845.00
32,179,201.00
57,928,899.00
1,409,860,576.00
1.04
2008
729,953.00
23,972,554.00
49,196,426.00
1,145,031,473.00
0.71
Processed Pork -- 0203
2009
4,138.00
67,280.00
23,570,523.00
88,163,508.00
0.23
2010
2,530.00
81,674.00
25,028,243.00
96,912,165.00
0.12
2011
4,641.00
166,910.00
30,179,798.00
116,692,863.00
0.11
2012
4,226.00
346,743.00
30,291,697.00
115,903,588.00
0.05
2008
10,153.00
67,723.00
26,829,086.00
98,114,989.00
0.55
Processed Sea Food -- 16
2010
5,985,728.00
26,023,035.00
37,284,848.00
1,158,109,425.00
7.14
2011
7,234,700.00
32,759,997.00
44,700,102.00
1,405,942,333.00
6.95
2012
7,520,451.00
32,179,201.00
46,571,110.00
1,409,860,576.00
7.08
2008
5,679,953.00
23,972,554.00
38,746,540.00
1,145,031,473.00
7.00
2009
5,389,604.00
22,840,957.00
34,789,018.00
1,029,694,969.00
6.98
Rubber -- 40
2009
9,017,555.00
152,497,203.00
124,547,858.00
12,327,153,144.00
5.85
2010
14,647,385.00
195,311,520.00
169,087,665.00
15,055,401,572.00
6.68
2011
22,048,104.00
228,823,973.00
231,285,024.00
17,999,547,615.00
7.50
2012
17,442,564.00
229,544,513.00
207,029,661.00
17,981,277,146.00
6.60
2008
11,575,960.00
175,907,915.00
157,241,363.00
15,989,372,712.00
6.69
Silk -- 50
2010
12,356.00
7,772,236.00
3,270,232.00
644,504,758.00
0.31
2011
14,434.00
8,356,317.00
3,400,828.00
759,366,823.00
0.39
2012
14,204.00
7,318,255.00
3,155,488.00
741,033,536.00
0.46
2008
23,553.00
7,211,219.00
3,539,764.00
651,119,216.00
0.60
2009
15,890.00
6,523,641.00
2,788,017.00
559,788,889.00
0.49
Soybean -- 1201
2010
1,550.00
90,140.00
39,777,897.00
67,958,125.00
0.03
2011
1,863.00
126,570.00
45,945,258.00
82,372,954.00
0.03
2012
1,626.00
125,959.00
53,213,002.00
93,347,148.00
0.02
2008
1,003.00
74,014.00
35,133,854.00
64,131,142.00
0.02
2009
1,263.00
82,572.00
33,030,560.00
58,629,852.00
0.03
Sugarcane -- 15
2011
3,635,149.00
3,883,822.00
36,522,391.00
53,499,118.00
1.37
2012
3,952,643.00
4,273,418.00
33,278,489.00
51,095,642.00
1.42
2008
1,431,705.00
1,645,422.00
18,741,678.00
32,790,534.00
1.52
2009
1,803,403.00
2,012,597.00
21,241,615.00
34,465,972.00
1.45
2010
2,152,394.00
2,373,068.00
29,635,399.00
44,479,001.00
1.36
Vegetable oil -- 15
2011
734,138.00
32,759,997.00
110,555,519.00
1,405,942,333.00
0.28
2012
675,071.00
32,179,201.00
105,664,551.00
1,409,860,576.00
0.28
2008
643,091.00
23,972,554.00
89,936,171.00
1,145,031,473.00
0.34
2009
261,759.00
22,840,957.00
66,072,671.00
1,029,694,969.00
0.18
2010
343,370.00
26,023,035.00
81,188,693.00
1,158,109,425.00
0.19
Wooden Sculptures -- 9703
2011
20,485.00
23,481.00
3,231,403.00
20,268,920.00
5.47
2012
4,790.00
29,515.00
3,459,348.00
23,058,941.00
1.08
2008
1,693.00
25,056.00
2,717,225.00
21,256,961.00
0.53
2009
12,822.00
14,085.00
2,429,125.00
15,343,597.00
5.75
2010
1,490.00
5,796.00
3,067,612.00
17,683,086.00
1.48