
| Cambodia >> Market Trend Analysis and CAGR |
|
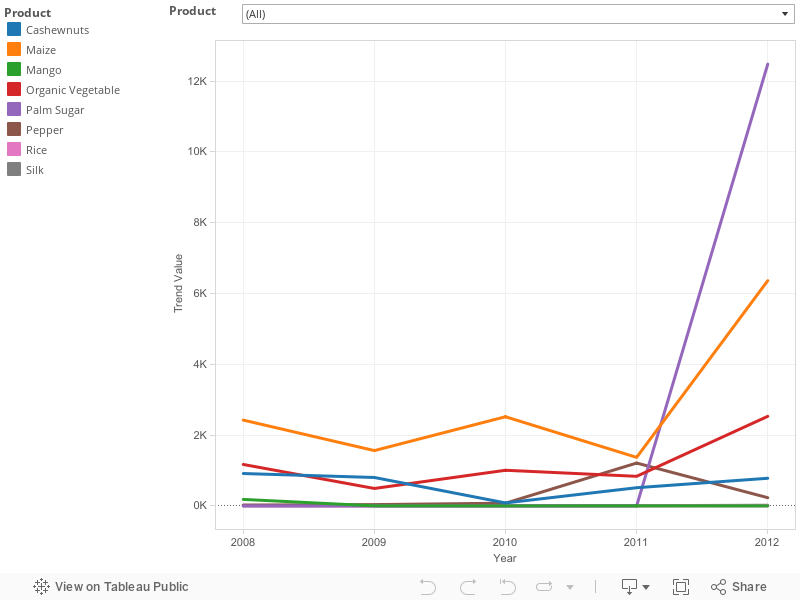
This trend report provided the last five year data and the performance analysis of HS code. The rates for each of the identified HS code have been calculated for the stipulated time period to give an indication about the export performance of commodity. So, the shown data on product name and value of trend in export in different year is the element of a product's export growth during a period of time for exporters.
The Compounded Annual Growth Rate (CAGR) is a tool which is often used to describe some element for the business and export performance of commodity by percentage. It has been calculated and indicated the element of a product's export growth during a period of time for exporters for the trends view, lets you know the export performance by each commodity and their region.
The CAGR is to indicate the element of a product's export growth during a period of time for exporters.
|
||||||||||||||||||||||||||||||||||||||||||||||||||||||||||||||||||||||

|
Copyright © 2013 - Mekong Institute. All right reserved.
123 Khon Kaen University Mittraphap Rd., Muang District, Khon Kaen 40002, THAILAND Tel. : +66(0)43-202-411 to 2 Fax.: +66(0)43-343-131 |