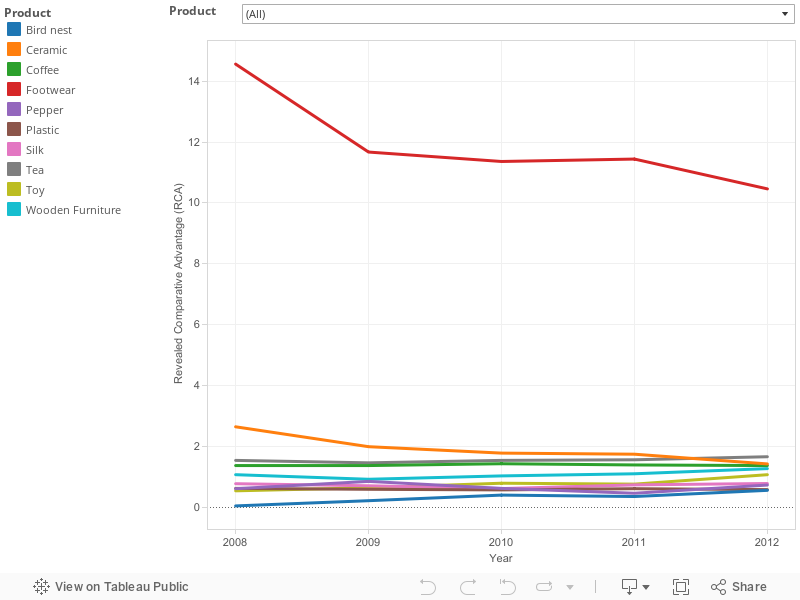
The Revealed Comparative Advantage (RCA) is a trade analysis tool to measure and assess the competitive advantage of the product which the business people need to export. The RCA indicates whether a country's product is in the process of extending the products in which it has a trade potential or simply competitive advantage. The values of an RCA indicate the country's competitiveness vis-à-vis the world. It also helps to assess a country's export potential.
Results indicated that
A value of less than unity implies that the country has a revealed comparative disadvantage in the product.
If the index exceeds unity, the country is said to have a revealed comparative advantage in the product.
Unit : US Dollar Thousand
Product -- HS Code
Year
Vietnam export to the World
Total exports from Vietnam
World's exports
World's total exports
RCA
Bird nest -- 210690
2008
1,072.00
48,851.00
22,319,087.00
45,065,924.00
0.04
2009
6,695.00
63,646.00
21,305,817.00
43,669,387.00
0.22
2010
15,393.00
78,088.00
23,378,671.00
47,390,666.00
0.40
2011
17,756.00
99,324.00
27,958,002.00
55,246,475.00
0.35
2012
49,343.00
177,185.00
27,994,733.00
55,857,354.00
0.56
Ceramic -- 69
2009
344,323.00
62,685,130.00
34,020,096.00
12,327,153,144.00
1.99
2010
267,183.00
57,096,274.00
39,598,691.00
15,055,401,572.00
1.78
2011
317,047.00
72,236,665.00
45,321,099.00
17,999,547,615.00
1.74
2012
359,240.00
96,905,674.00
46,811,764.00
17,981,277,146.00
1.42
2008
334,856.00
48,561,343.00
41,704,633.00
15,989,372,712.00
2.64
Coffee -- 090111
2009
2,108,148.00
2,113,761.00
15,942,351.00
21,958,099.00
1.37
2010
1,714,615.00
1,730,570.00
13,840,651.00
19,940,647.00
1.43
2011
1,838,311.00
1,851,411.00
17,316,192.00
24,292,892.00
1.39
2012
2,735,739.00
2,761,069.00
26,139,427.00
36,155,744.00
1.37
2008
1,912,853.00
1,916,650.00
12,953,439.00
17,730,897.00
1.37
Footwear -- 6403
2008
4,872,365.00
62,685,130.00
82,100,319.00
12,327,153,144.00
11.67
2009
4,151,908.00
57,096,274.00
96,377,052.00
15,055,401,572.00
11.36
2010
5,229,846.00
72,236,665.00
113,863,887.00
17,999,547,615.00
11.44
2011
6,717,915.00
96,905,674.00
119,165,542.00
17,981,277,146.00
10.46
2007
4,076,199.00
48,561,343.00
92,163,673.00
15,989,372,712.00
14.56
Pepper -- 090411
2010
310,029.00
349,368.00
1,070,907.00
2,291,224.00
1.90
2011
362,070.00
422,626.00
1,609,396.00
3,282,773.00
1.75
2012
637,199.00
733,918.00
1,733,660.00
3,421,858.00
1.71
2008
261,200.00
272,109.00
960,536.00
2,146,736.00
2.15
2009
283,993.00
312,117.00
803,277.00
1,941,144.00
2.20
Plastic -- 39
2009
1,043,328.00
57,096,274.00
484,323,731.00
15,055,401,572.00
0.57
2010
1,371,288.00
72,236,665.00
564,130,131.00
17,999,547,615.00
0.61
2011
1,749,499.00
96,905,674.00
557,509,139.00
17,981,277,146.00
0.58
2007
900,710.00
48,561,343.00
480,651,629.00
15,989,372,712.00
0.62
2008
1,159,568.00
62,685,130.00
389,331,890.00
12,327,153,144.00
0.59
Silk -- 50
2010
32,442.00
10,416,646.00
3,270,232.00
644,504,758.00
0.61
2011
43,779.00
13,303,732.00
3,400,828.00
759,366,823.00
0.73
2012
55,712.00
16,760,022.00
3,155,488.00
741,033,536.00
0.78
2008
36,202.00
8,603,181.00
3,539,764.00
651,119,216.00
0.77
2009
35,671.00
10,150,690.00
2,788,017.00
559,788,889.00
0.71
Tea -- 090220&090240
2010
188,321.00
200,536.00
3,860,973.00
6,403,753.00
1.56
2011
200,873.00
205,539.00
4,053,543.00
6,897,100.00
1.66
2007
121,569.00
133,497.00
2,663,550.00
4,501,832.00
1.54
2008
131,794.00
147,326.00
3,348,655.00
5,481,436.00
1.46
2009
165,842.00
180,219.00
3,246,209.00
5,440,751.00
1.54
Toy -- 95
2011
373,424.00
96,905,674.00
91,809,782.00
17,999,547,615.00
0.76
2012
656,811.00
123,478,958.00
89,442,426.00
17,981,277,146.00
1.07
2008
207,930.00
62,685,130.00
97,823,814.00
15,989,372,712.00
0.54
2009
243,342.00
57,096,274.00
82,377,945.00
12,327,153,144.00
0.64
2010
317,545.00
72,236,665.00
84,197,590.00
15,055,401,572.00
0.79
Wooden Furniture -- 940360
2011
828,687.00
2,258,114.00
24,452,729.00
73,067,604.00
1.10
2012
1,396,917.00
3,595,447.00
24,596,923.00
78,886,570.00
1.25
2008
636,408.00
1,841,554.00
23,238,723.00
71,639,706.00
1.07
2009
538,297.00
1,739,687.00
19,786,509.00
58,757,851.00
0.92
2010
761,283.00
2,129,562.00
22,623,220.00
65,229,067.00
1.03