|
This application gives you a readymade list of top five of the performance of major countries for all the products on importance of Existing Exporter and Potential Importer in the world for the concerned region.
After having identified the major existing markets and the potential ones, the right export market based on TII is to analyze the trends in these countries. For this purpose two kinds of trends have been analyzed (i) trend in exports from GMS country to these markets and (ii) trend in imports from the World into these markets.
When you selected menu/icon of TII of any country and put mouse over each Bar Chart in different colour, it will show the data of product name, year and TII value. In the table below, viewer can see lists of Existing Exporter and Potential Importer on specific product which selected based on top product analysis.
The result shown can be described according to the situation below ;
|
Situation
|
Exports from GMS country
|
Imports from the World
|
Interpretation
|
|
Situation 1
|
Rising
|
Rising
|
Best combination
|
|
Situation 2
|
Rising
|
Declining
|
Understanding that the import demand in these markets is declining, GMS exporter should consider diversifying from these markets to newer ones.
|
|
Situation 3
|
Declining
|
Rising
|
Understanding that the import demand in these markets is rising, GMS exporter should consider diversifying into these markets.
|
|
Situation 4
|
Declining
|
Declining
|
Worst combination
|
|
|
|
|
|
|
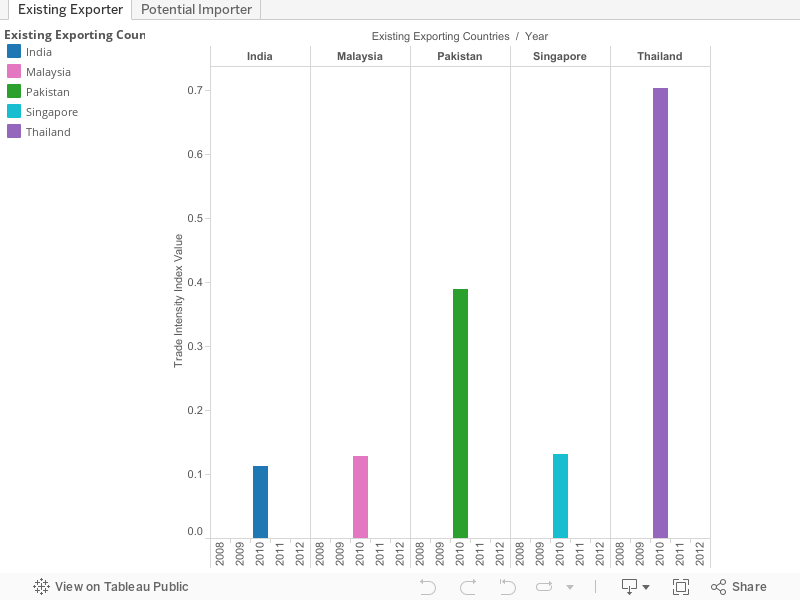
Existing Exporter (EEx) of Trade Intensity Index for the Product
with Respect to Major Markets: Chickpeas ( 071320)
|
|
Unit : US Dollar Thousand
|
|
|
Export Markets
|
|
|
Myanmar's Export into market
|
World Product's Export into market
|
|
|
Export Country
|
Year
|
Product
|
Product (4-digit)
|
Product
|
Product (4-digit)
|
TII
|
|
Existing Exporters
|
|
India |
2008 |
N.A |
N.A |
115,849 |
1,459,460 |
N.A |
|
2009 |
N.A |
N.A |
149,075 |
2,062,010 |
N.A |
|
2010 |
3,028 |
586,669 |
85,783 |
1,865,610 |
0.11 |
|
2011 |
N.A |
N.A |
108,715 |
1,850,670 |
N.A |
|
2012 |
N.A |
N.A |
355,551 |
2,272,320 |
N.A |
|
Malaysia |
2010 |
165 |
24,048 |
4,640 |
87,127 |
0.13 |
|
2011 |
N.A |
N.A |
6,395 |
91,989 |
N.A |
|
2012 |
N.A |
N.A |
6,072 |
76,959 |
N.A |
|
2008 |
N.A |
N.A |
1,924 |
41,720 |
N.A |
|
2009 |
N.A |
N.A |
4,238 |
65,790 |
N.A |
|
Pakistan |
2009 |
N.A |
N.A |
106,646 |
254,468 |
N.A |
|
2010 |
735 |
4,696 |
148,198 |
368,031 |
0.39 |
|
2011 |
N.A |
N.A |
184,322 |
395,157 |
N.A |
|
2012 |
N.A |
N.A |
166,719 |
407,292 |
N.A |
|
2008 |
N.A |
N.A |
46,807 |
196,826 |
N.A |
|
Singapore |
2009 |
N.A |
N.A |
1,689 |
14,745 |
N.A |
|
2010 |
1,763 |
119,535 |
2,622 |
23,254 |
0.13 |
|
2011 |
N.A |
N.A |
2,862 |
23,616 |
N.A |
|
2012 |
N.A |
N.A |
2,416 |
19,611 |
N.A |
|
2008 |
N.A |
N.A |
1,695 |
16,092 |
N.A |
|
Thailand |
2009 |
N.A |
N.A |
195 |
21,977 |
N.A |
|
2010 |
170 |
50,738 |
182 |
38,187 |
0.70 |
|
2011 |
N.A |
N.A |
267 |
29,789 |
N.A |
|
2012 |
N.A |
N.A |
449 |
23,507 |
N.A |
|
2008 |
N.A |
N.A |
216 |
12,308 |
N.A |
|
|
|
Potential Importer of Trade Intensity Index for the Product
with Respect to Major Markets: Chickpeas ( 071320)
|
|
Unit : US Dollar Thousand
|
|
|
Export Markets
|
|
|
Top importers from the World
|
World Product's Import from market
|
|
|
Export Country
|
Year
|
Product
|
Product (4-digit)
|
Product
|
Product (4-digit)
|
TII
|
|
Potential Importers
|
|
Algeria |
2009 |
N.A |
N.A |
49,888 |
162,411 |
N.A |
|
2010 |
N.A |
N.A |
59,513 |
208,638 |
N.A |
|
2011 |
N.A |
N.A |
86,850 |
286,464 |
N.A |
|
2012 |
N.A |
N.A |
94,779 |
217,485 |
N.A |
|
2008 |
N.A |
N.A |
47,298 |
190,420 |
N.A |
|
Bangladesh |
2009 |
N.A |
N.A |
68,444 |
345,857 |
N.A |
|
2010 |
N.A |
N.A |
85,974 |
351,367 |
N.A |
|
2011 |
N.A |
N.A |
58,304 |
190,971 |
N.A |
|
2012 |
N.A |
N.A |
81,377 |
256,565 |
N.A |
|
2008 |
N.A |
N.A |
44,009 |
111,180 |
N.A |
|
India |
2008 |
N.A |
N.A |
115,849 |
1,459,460 |
N.A |
|
2009 |
N.A |
N.A |
149,075 |
2,062,010 |
N.A |
|
2010 |
3,028 |
586,669 |
85,783 |
1,865,610 |
0.11 |
|
2011 |
N.A |
N.A |
108,715 |
1,850,670 |
N.A |
|
2012 |
N.A |
N.A |
355,551 |
2,272,320 |
N.A |
|
Pakistan |
2009 |
N.A |
N.A |
106,646 |
254,468 |
N.A |
|
2010 |
735 |
4,696 |
148,198 |
368,031 |
0.39 |
|
2011 |
N.A |
N.A |
184,322 |
395,157 |
N.A |
|
2012 |
N.A |
N.A |
166,719 |
407,292 |
N.A |
|
2008 |
N.A |
N.A |
46,807 |
196,826 |
N.A |
|
Spain |
2010 |
N.A |
N.A |
57,149 |
223,066 |
N.A |
|
2011 |
N.A |
N.A |
56,319 |
243,170 |
N.A |
|
2012 |
N.A |
N.A |
75,966 |
315,580 |
N.A |
|
2008 |
N.A |
N.A |
64,771 |
229,657 |
N.A |
|
2009 |
N.A |
N.A |
46,256 |
188,428 |
N.A |
|
|
|